
Sitoo_2026_Sessions_DK_event_backdrop
Retail technology report · 2026

The great TCO illusion

Why legacy retail tech quietly erodes margin — and how cloud-native POS creates measurable returns.
Executive summary

A better way to understand POS cost

For years, the best retailers in the business have been told that a monolithic, all-in-one system was the safe bet: one vendor, one licence, one simple total cost of ownership.
But today's retail landscape is wildly different. Stores now need to do far more than sell. They need to be fulfilment and return hubs, customer data capture points, and the place where your brand comes to life. And they need the flexibility to adapt to constantly changing customer expectations.
The simple reality is this — legacy POS was built for a more static world. This creates a very simple financial problem: the price of a legacy system doesn't show the full cost. The real TCO is hidden in infrastructure, support, manual workarounds, and missed commercial opportunities.

The visible cost of a cloud-native POS

Licence fees, hardware and project spend.

The hidden costs of a legacy POS

Servers, patching, field service, support tickets, slow workflows, missed sales, and delayed change.

The old question

What does the POS cost?

The better question

What does the current setup cost us to run — and what could a modern platform return?

1. The true cost of legacy POS

The cost goes deeper than what you pay for it

When inventory isn't truly real-time, associates lose sales. When updates require manual effort, IT loses time. When returns are slow, stores lose conversion. When tills fail or queues build, customers leave.

In isolation, each issue looks manageable. Across 50 stores, over multiple years, they become a real drag on margin and agility.

sitoo_icon_campaign_80

Cost removal

Servers, field service, patching, hardware energy, support load and training effort.
sitoo_icon_360_80

Strategic agility

Faster rollouts, fewer fragile workarounds, and easier integrations.
sitoo_icon_rocket_80

Store productivity

Faster checkout, stocktaking, shipment receiving, returns, and end-of-day processes.
sitoo_icon_capture_rate_80

Commercial upside

Saved sales, higher order value, stronger customer capture, better upsell, and more effective omnichannel fulfilment.
2. Investment

What changes when you move to cloud-native

A modern POS transformation requires investment. That should be made explicit, not buried. Separate implementation cost from ongoing operating cost, then compare both against the return created by the new model.

Investment area What it covers Viewed through the CFO lens
Implementation and onboarding Project setup, configuration, enablement and rollout support. One-time investment that accelerates time to value.
Systems integration Connections to e-commerce, ERP, CRM, payments, loyalty and inventory services. Creates the data flow required for omnichannel ROI.
Store hardware refresh Shift from fixed PC-based setups and local infrastructure to flexible, mobile store devices. Should be modelled against avoided server, PC, field service and energy costs.
Subscription licensing Cloud-native POS platform licensing and continuous product updates. Should be compared with legacy licence, support, and maintenance spend.
Internal change effort Training, process alignment, rollout governance and adoption management. Short-term effort designed to reduce long-term complexity.
3. Where ROI comes from

Two forms of return,
working together

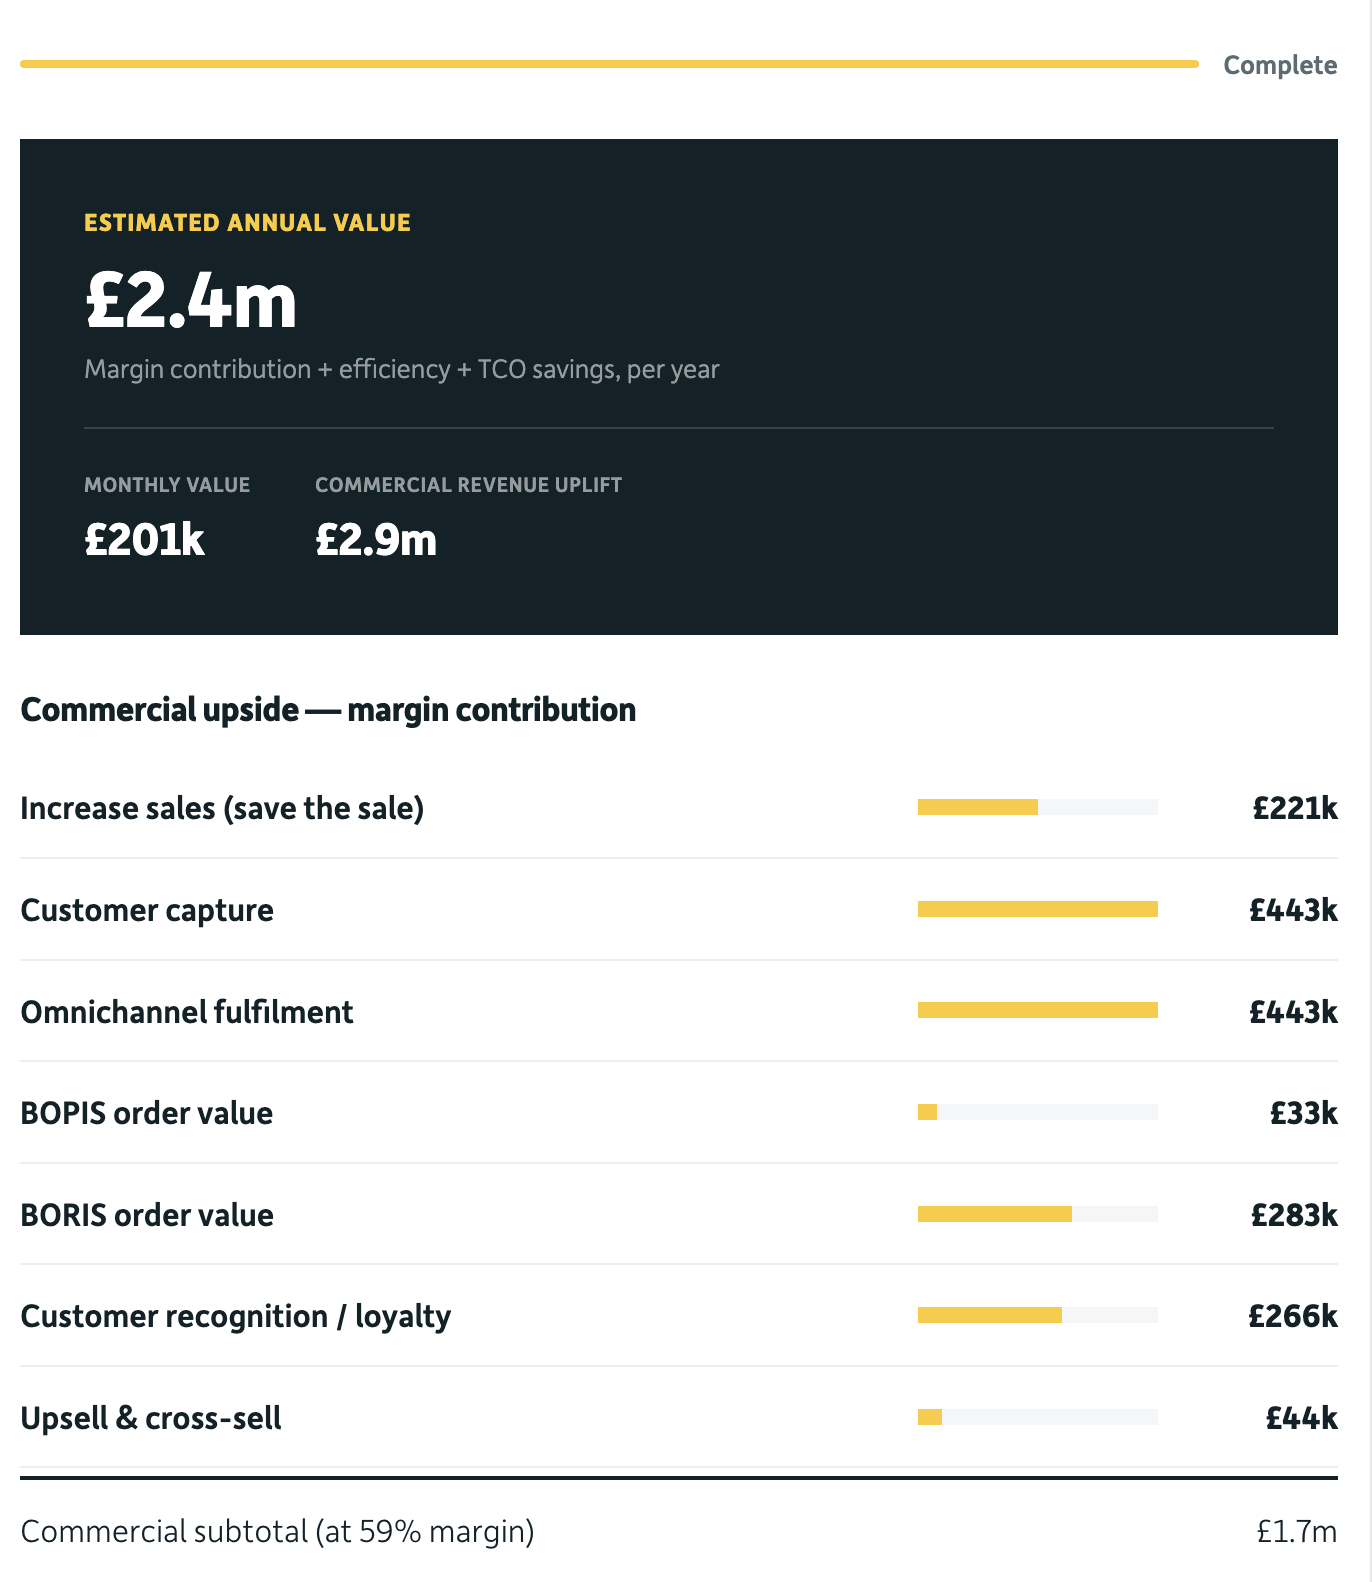
Commercial upside from small, realistic improvements in sales, order value, customer capture and fulfilment. And TCO reduction as legacy infrastructure disappears.

Commercial benefit drivers

The model uses deliberately conservative percentages. Figures are illustrative planning assumptions based on a 50-store fashion and lifestyle retailer with £60m annual revenue (£1.2m per store) and a 60% gross margin.

Swipe left to see more →

Driver Potential impact Why it matters How to model it
BOPIS order value 0.5% increase Store pickup creates additional in-store purchase opportunities and reduces delivery friction. Eligible BOPIS order value × uplift × gross margin
BORIS order value 8% increase In-store returns can become exchanges or new purchases when associates have the right tools. Relevant in-store return flows × uplift × gross margin
Customer capture 1% increase A connected, cloud-native POS makes customer capture far easier and quicker. Store revenue or conversion baseline × uplift × gross margin
Customer recognition 2% increase Instant identification and loyalty recruitment shift more transactions into known-customer journeys. Member sales mix × uplift × AOV gap
Omnichannel sales & fulfilment 4% increase Endless aisle, real-time inventory and store fulfilment reduce the number of times associates have to say no. Orders/customers baseline × uplift × gross margin
Upsell and cross-sell 0.1% increase Product relationships, customer history and campaign context help associates increase basket size. Annual revenue × uplift × gross margin

Operational efficiency drivers

These are easy to underestimate because they show up as small time savings in everyday tasks. But across 50 stores, one hour saved each month becomes 600 hours saved each year.

Swipe left to see more →

Workflow Potential impact Why it matters How to model it
Stocktaking 50% time saving Faster counts with mobile, intuitive workflows. Hours saved per store per month × stores × loaded hourly cost
Shipment receiving 75% time saving Quicker delivery-in process with fewer manual steps and fewer errors. Receiving hours per store per month × stores × loaded hourly cost
End of day 50% time saving Less manual administration and reconciliation at store close. Admin hours saved × loaded hourly cost
Returns Fewer transactions Validated sale and return flows reduce duplicated payment and processing steps. Avoided transaction fees plus time saved
Training 70–80% reduction Intuitive workflows reduce time needed to onboard new store associates. New hires × training hours avoided × loaded hourly cost
125 %
Increase in endless aisle sales at Varner Group
230 %
Increase in endless aisle order value at Varner Group
125 %
Increase in BORIS order value at Varner Group
4. The cost categories legacy hides

What disappears when the infrastructure does

Traditional POS carries significant hidden costs: local servers, field service, manual patching, recurring IT involvement, energy consumption and support load. A cloud-native model removes or drastically reduces most of them.

Swipe left to see more →

Cost area What changes Typical impact
Server infrastructure Removal of local in-store servers, hosting and backup environments. 100% elimination
Server energy and cooling Elimination of energy use linked to in-store servers. 100% elimination
Maintenance & patching Automatic updates remove internal IT or consultant time. 100% elimination
Field service cost No POS-related onsite visits required post-implementation. 100% elimination
Support load Support time is drastically reduced across the board. 95–98% reduction
Hardware and POS energy Replacement of PC-based POS at about 100 W/h with tablets at about 22 W/h. 75–80% reduction
Training and onboarding Training takes minutes rather than days. 70–80% reduction
5. Change in action

Retailers who made the case

They ran the numbers, moved to cloud-native POS, and saw higher sales, faster stores and lower costs.

Osprey London

  • Retail sales up ~12–14% year on year without major operational changes.
  • Stock accuracy improved to 98–99%, with in-hours stock counting.
  • Fixed POS replaced with mobile tablet-based checkout.
  • Faster deployment of tools and changes, with lower hardware costs.

Varner Group

  • Endless aisle sales up 125% in the first year.
  • Endless aisle order value up 230%.
    BORIS order value up 125%.
  • Fewer support incidents and fewer calls to the help desk.

Rally House

  • Customer capture at the POS almost doubled.
  • Tech cost down substantially.
  • Store teams onboarded quickly, even at peak trading.
6. The cost of doing nothing

Delay feels safe. It has a number.

If legacy is already creating lost sales, avoidable support and slow workflows, the business is paying for it every month. Take our ROI calculator to see what a small, realistic amount of leakage is worth across your estate.

  • Out-of-stocks solved by endless aisle or cross-store fulfilment.
  • Queues and slow checkout in peak trading moments.
  • Returns that stay refunds instead of becoming exchanges.
  • Inventory in the wrong location, cleared through markdowns.
  • IT and store teams tied up in support and manual processes.
TCO-results-dashboard
Take it with you

The whole report, yours to keep

Twelve pages covering the true cost of legacy POS, how to frame the investment, where the ROI comes from, and what delay is costing you. No form to fill in.

Sitoo_2025_gartner_v2_web_block (1)

Turn this into your own business case

Take these insights into action. We'll build a tailored ROI and TCO analysis from your real revenue, margin, support load and store workflows — and show exactly what legacy is quietly costing you every month.

Turn this into your own business case

Take these insights into action. We'll build a tailored ROI and TCO analysis from your real revenue, margin, support load and store workflows — and show exactly what legacy is quietly costing you every month.